Data Modification and Visualization
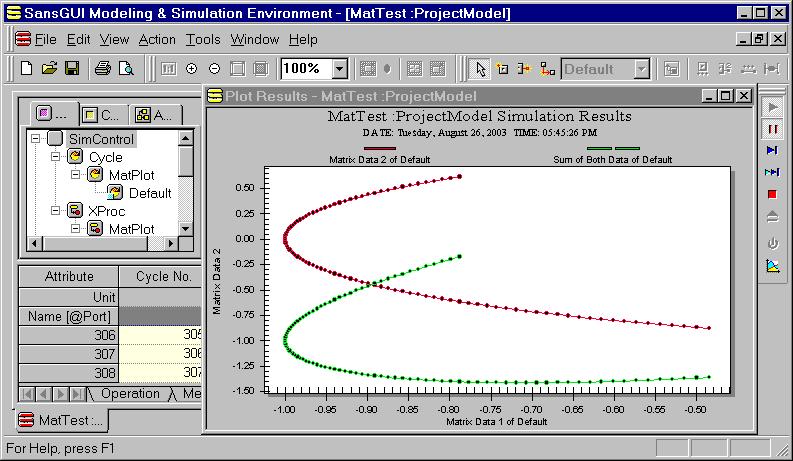
Change values and plot data dynamically during run-time.
While a simulation is paused, the data can be examined and modified if needed.
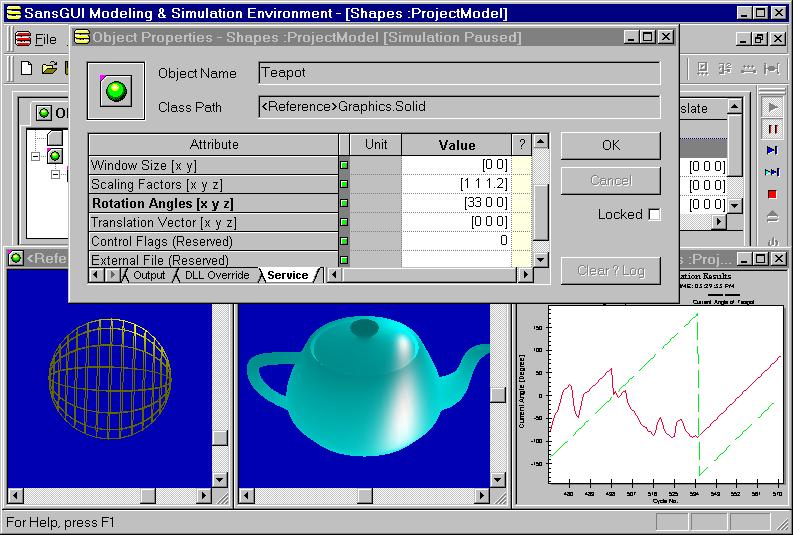
The user can control the number of data points to be plotted at each frame in the dynamic chart during a simulation run. With SansGUI's dynamic charting facility, displaying strip charts in scientific and engineering applications becomes very simple; it does not require any programming by the simulation developers or users.
SansGUI Modeling and Simulation Environment version 1.2
Copyright © 2000-2003 ProtoDesign, Inc. All rights reserved.