|
| |
SansGUI Getting Started Guide Examples
The following examples demonstrates some of the features and capabilities
available in the SansGUI Modeling and Simulation Environment. All these
examples are extracted from A
Tour of SansGUI Examples section in the SansGUI Getting
Started guide. If you would
like to have some hands-on experience with SansGUI, you can go to the Download
page to obtain an evaluation copy of the software including all examples and
their source code.
- Cool -- Coffee Cup Cooling Effect: demonstrates
a simple model of a cooling cup of coffee. Multiple cups of coffee
are added to show the object-oriented nature of SansGUI.
-
MatPlot -- Sine and Cosine
Wave Generation and Plotting: demonstrates how to generate a sine
and a cosine waves by simulator DLL routines and store the data points in a
matrix. The matrix is looked up during a simulation
run. The values in the two curves are added and then plotted.
-
Feel -- Dynamic Model of Human
Feelings: shows the feeling responses while a person is pushing a
ball and then bumping into an obstacle. This example also demonstrates how
to plot strip charts.
-
IAC -- Interactive Activation and
Competition: demonstrates inexact and associative information
retrieval in a database using an artificial neural network. This
example also shows how to take advantage of SansGUI's subassembly handling
capability.
-
New
Solid -- Interactive 3D Graphics in SansGUI:
explores the new interactive 3D graphics features in the new SansGUI
version 1.2 and demonstrates how SansGUI supports Silicon Graphics OpenGL
programming directly in Microsoft Visual C++ and Compaq Visual Fortran.
Cool -- Coffee Cup Cooling Effect
-
Description
This example demonstrates a simplistic thermal
dynamics model involving a cup of coffee. We use this example as the
first lesson that introduces the terms and concepts of SansGUI.
-
Demonstration
Click on a picture to obtain its full size screen
shot.
|
 |
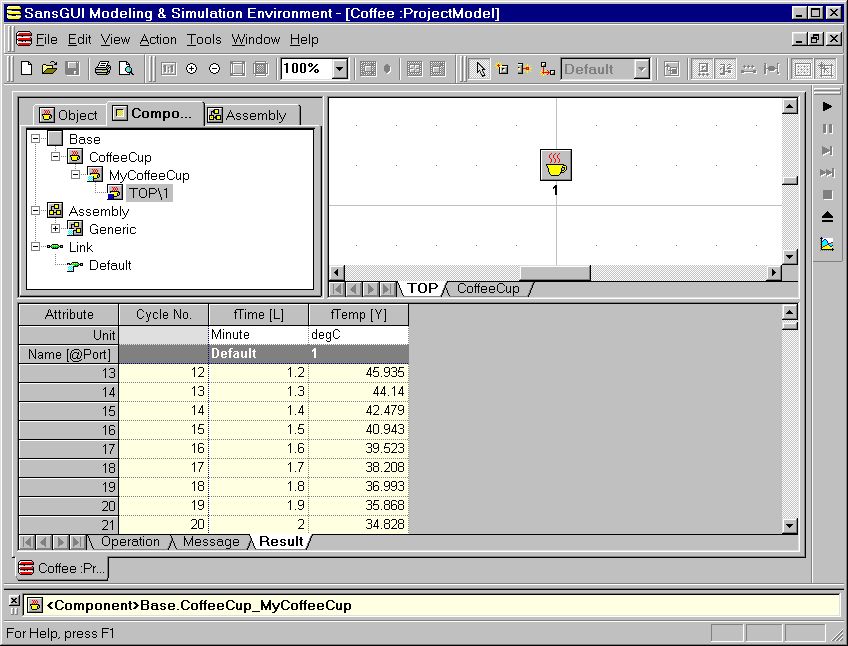
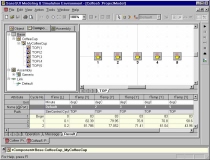
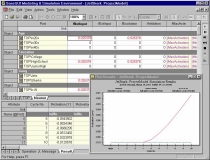
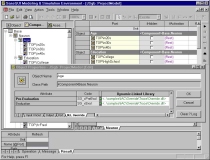
A simple cup of coffee model. The
left pane contains the classes, objects, and parts in the system.
The right pane shows the system parts, a coffee cup in this case, in a
Canvas View of the TOP assembly. The
bottom pane displays the resulting data from a simulation run. |
|
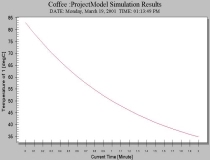 |
The dropping temperature data in the simulation results are plotted using
the plotting facility in the SansGUI environment. |
|
 |
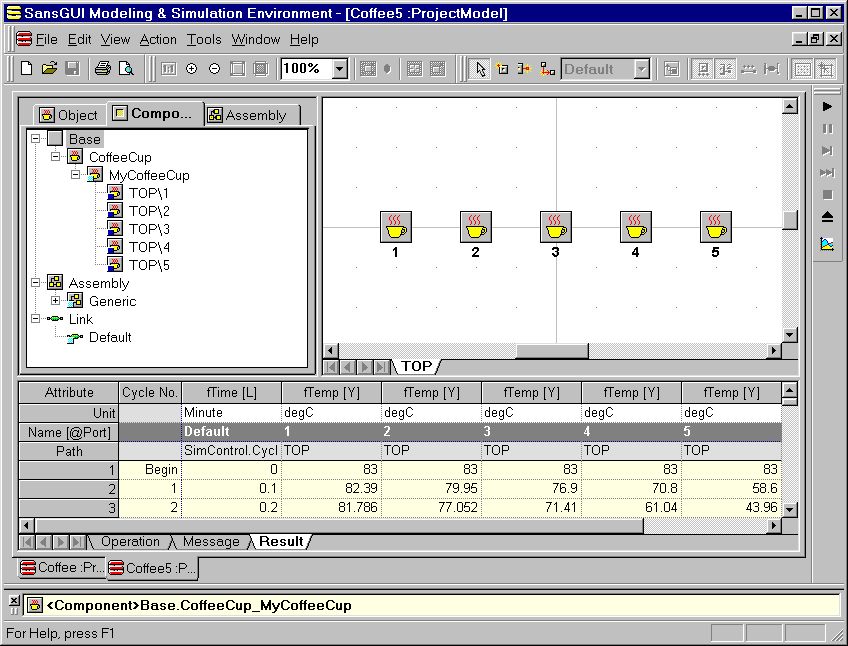
Five cups of coffees are created from the
same coffee cup object to inherit its values. This is accomplished without any
simulator
code change. |
|
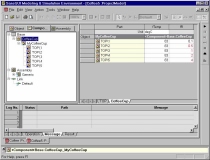 |
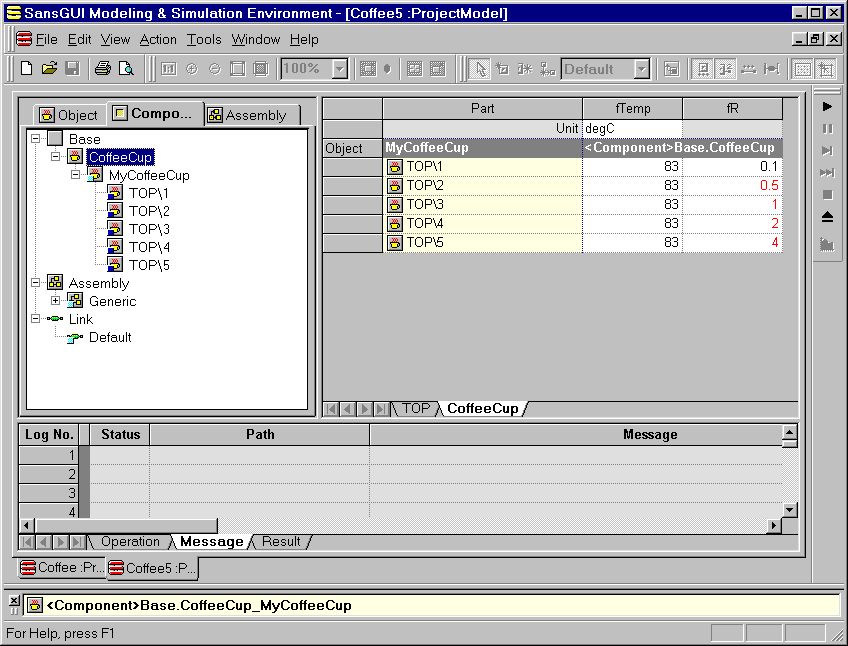
For each coffee cup, the cooling constants
are changed by overriding the object values at the part level (shown in
red). |
|
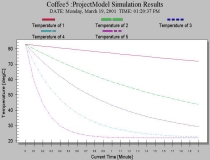 |
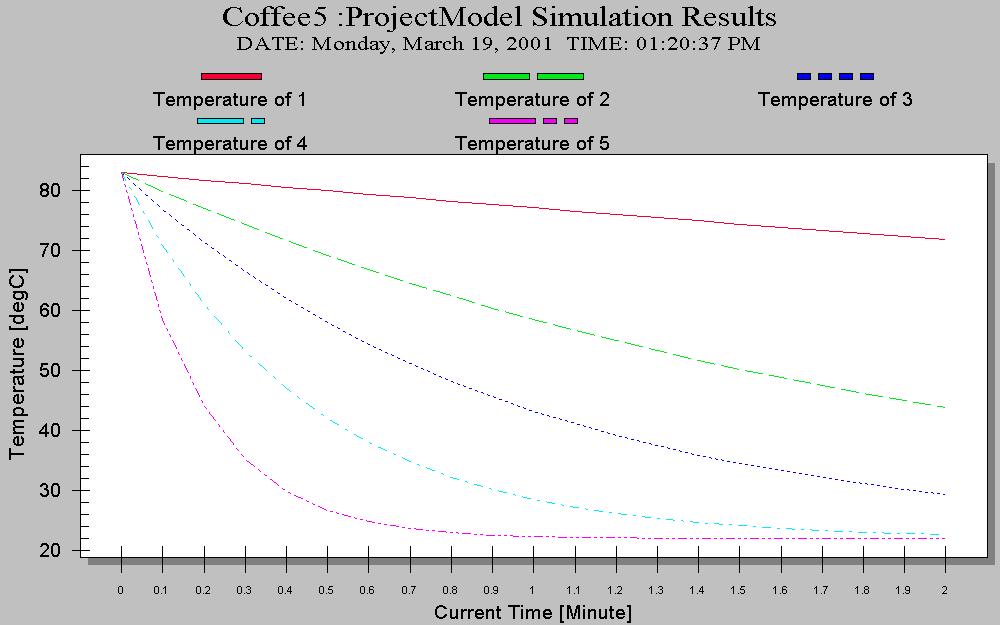
The dropping temperatures data from the five coffee
cups with different
cooling constants are plotted. |
-
Details
In this example, we simulate the
cooling effect of a cup of coffee in a very simple manner:
Temperature(T+dT) = Temperature(T) +
(-R) * (Temperature(T) - RoomTemperature) * dT
where T is the simulated time, dT is
the time step, R is the cooling constant, Temperature(T) is
the temperature of the coffee at time T and RoomTemperature is
an input attribute, which will stay constant throughout the simulation.
-
Code
The implementation of this example can be found in
the evaluation functions of two classes: Base.CoffeeCup and Collection.Clock.
Click on the following links to see all the necessary code for this
project. The C/C++ and Fortran implementations are independent; only
one of them is required.
-
Download
Please go to the Download
page to obtain an evaluation copy of SansGUI, which includes this example.
-
Credit
This example is extracted from A Tour
of SansGUI Examples in the SansGUI Getting
Started guide.
MatPlot -- Sine and Cosine Wave
Generation and Plotting
-
Description
This example shows how to generate the data for one
circular cycle (360 degrees) of a sine and cosine wave using a Load Data
routine and stores the data in
a two column matrix for manipulation.
-
Demonstration
Click on a picture to obtain its full size screen
shot.
|
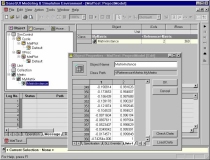 |
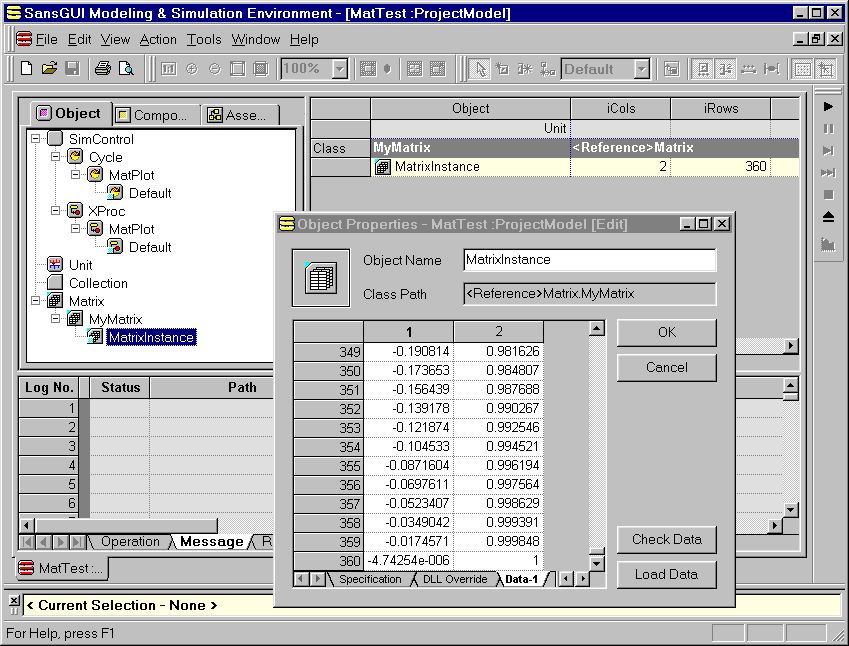
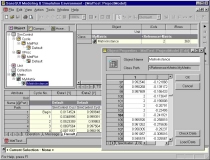
The sine and cosine wave generation
routines can be called when the user clicks on the Load Data button
in the Matrix Object Properties dialog. The routines first
resize the matrix and then populate the matrix with the sine and cosine
wave data. |
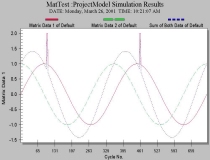
|
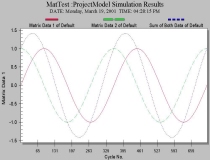 |
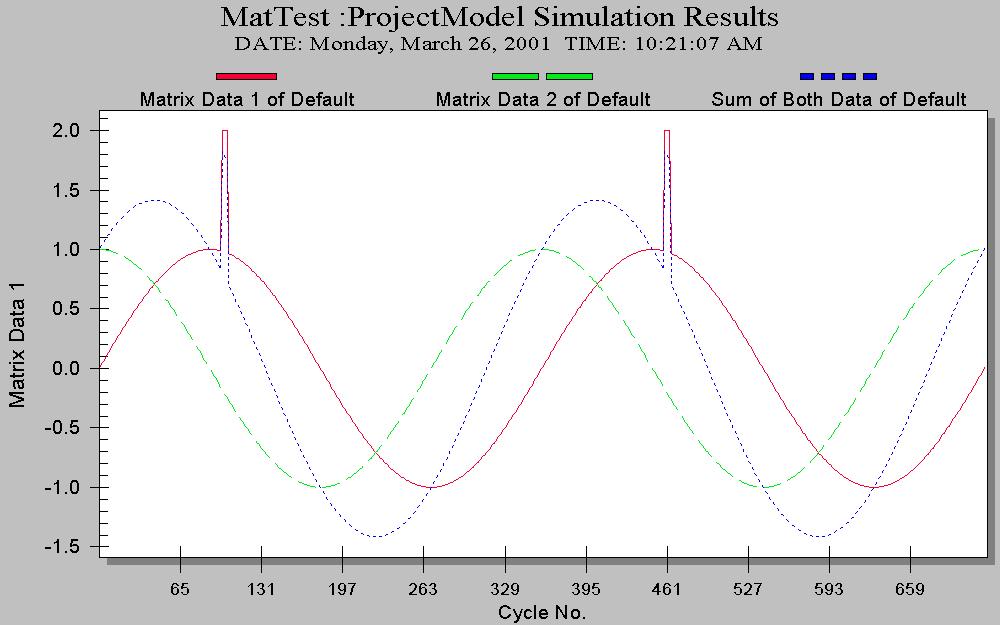
The sine and cosine curves and their sum
are plotted as a result. The simulation runs for two cycles (720
degrees). |
|
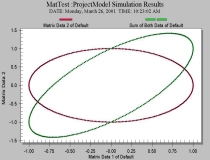 |
Plot cosine data and the sum of sine and
cosine values as the
y-coordinates against the sine data along the x-axis. |
|
 |
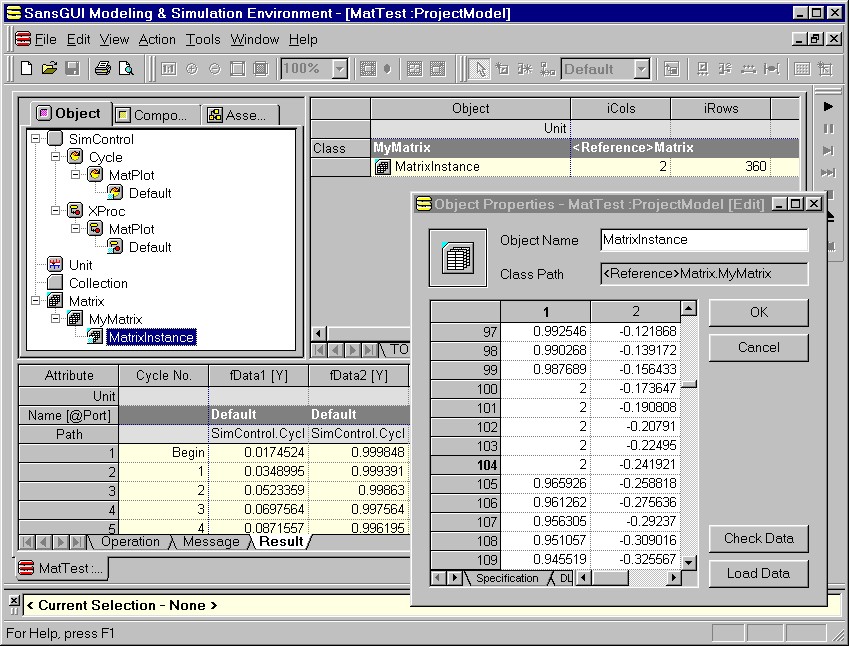
The data in the matrix can be modified by
the user to introduce a "spike." |
|
 |
The data curves with the "spikes"
are plotted. Because the simulation run is involved with two cycles
(720 degrees), there are two spikes. |
-
Details
In this example, we demonstrate
the use of the Resize and Load Data functions in the Matrix
class to generate and store sine and cosine wave data. The matrix is
looked up during simulation runs with the sum of their values
calculated. Two circular cycles (720 degrees) are shown in this
example, but the actual duration can easily be set up in the simulation
control object by the user.
-
Code
The implementation of this example can be found in
the functions of the Matrix.MyMatrix class. Click on the following
links to see all the necessary code for this
project. The C/C++ and Fortran implementations are independent; only
one of them is required.
-
Download
Please go to the Download
page to obtain an evaluation copy of SansGUI, which includes this example.
-
Credit
This example is extracted from A Tour
of SansGUI Examples in the SansGUI Getting
Started guide.
Feel -- Dynamic Model of Human
Feelings
-
Description
In this example, we model a person pushing a ball.
The velocity of the ball gives a signal to the person as feedback on how
well he is doing, captured by the progress center in the person's feeling
system. There is also a surprise center in the system that
takes an input from the progress center. A sudden change of progress,
such as in the situation of "bumping into an obstacle" results in
a jerk in the surprise center.
-
Demonstration
Click on a picture to obtain its full size screen
shot.
|
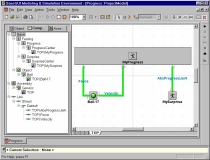 |
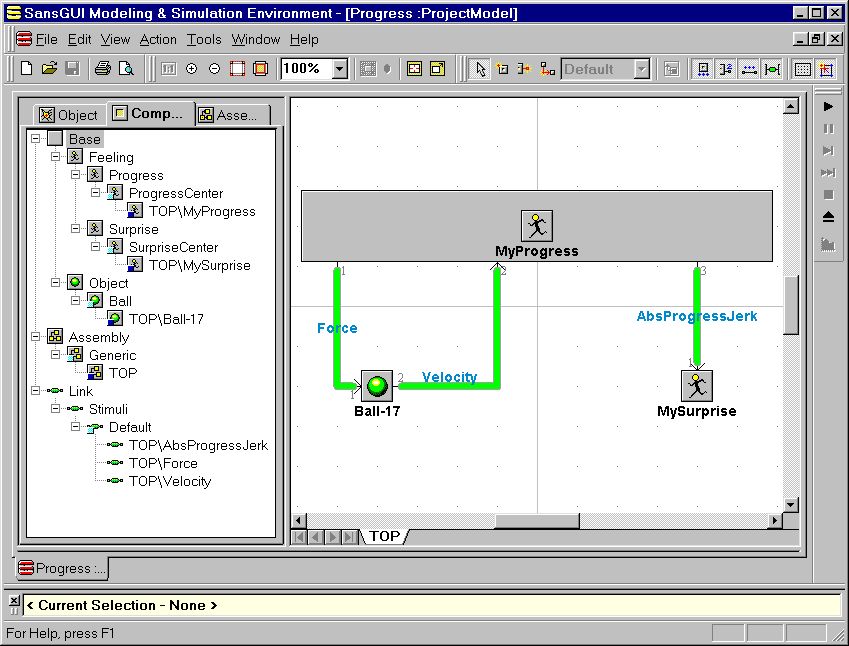
The relationships among the ball, the
progress center and the surprise center are drawn on the Canvas View with
links that carry signals from one to the other.. |
|
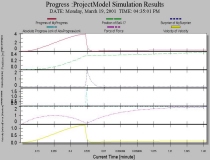 |
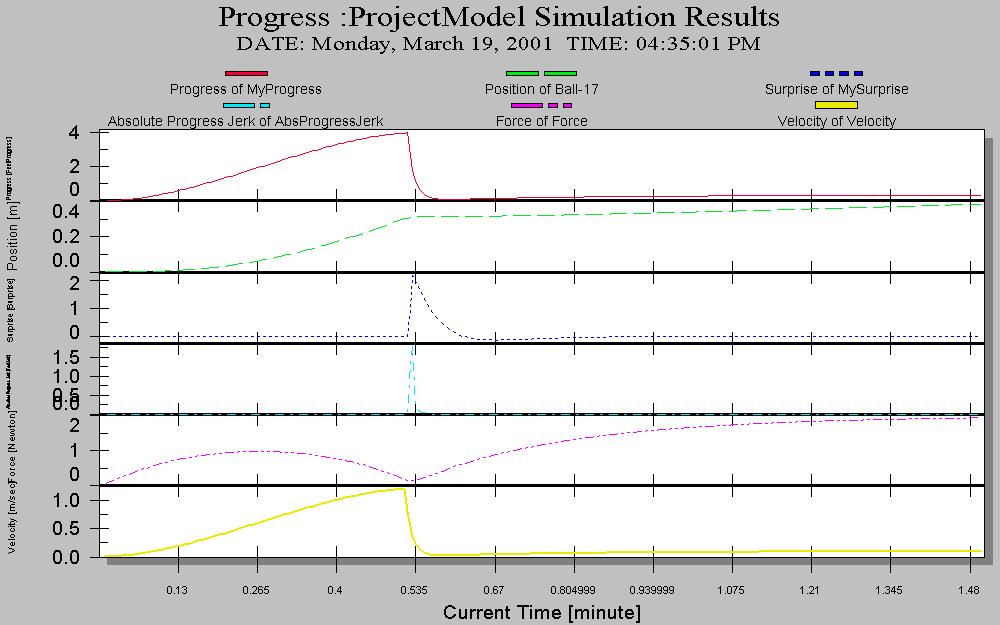
The simulation results are plotted as strip
charts using
the plotting facility in the SansGUI environment. |
-
Details
At some point of the simulated
time, 0.5 minutes in this example, the ball is blocked by an obstacle, and the
velocity is suddenly dropped. This, in turn, blocks out the feeling of
progress and causes a jerk to be sent to the surprise center. The
signal levels in the progress and surprise centers record the two feelings
of the person throughout the event. The surprise center is modeled
with two leaky capacitors to represent the fading signal levels of such
feeling in the person's memory.
-
Code
The implementation of this example can be found in
the functions of the Base.Object, Base.Feeling.Progress, Base.Feeling.Surprise,
and Collection.Clock classes. Click on the following link to
see all the necessary code for this
project.
-
Download
Please go to the Download
page to obtain an evaluation copy of SansGUI, which includes this example.
-
Credit
This example is extracted from A Tour
of SansGUI Examples in the SansGUI Getting
Started guide. We thank Dr.
Peter H. Greene of Illinois
Institute of Technology, Chicago, Illinois, for providing this
interesting example.
IAC -- Interactive Activation and
Competition
-
Description
This artificial neural network example implements
an Interactive Activation and Competition (IAC) network for inexact,
associative, contents-driven database search. It models the profiles
of 27 members from two gangs, the Jets and the Sharks. Each member has five
attributes: name, age, marital status, education level, and
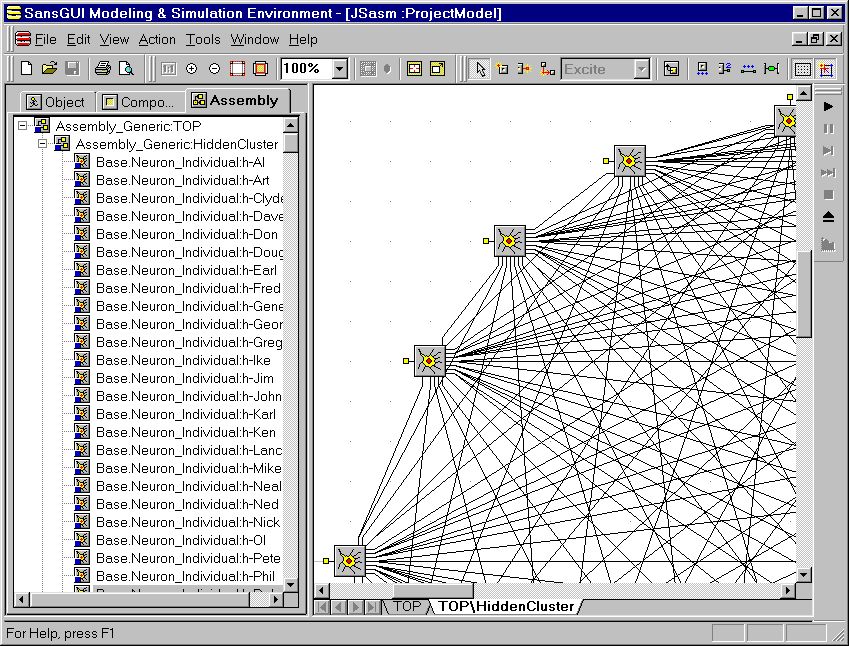
occupation. The neural network model has all the possible values in
these attributes represented by nodes (neurons) in clusters. At the
center of the model, there are
27 "hidden" nodes representing the 27 members. The other 27
node cluster represents the name strings of the 27 members. There are
clusters for other attributes of the members. For example, the age
cluster contains in20s, in30s, and in40s nodes and the
educational level cluster contains JuniorHigh, HighSchool, and
College nodes. Each attribute cluster is completely connected
with inhibition links, meaning that when one is on, or with a high
activation level, the other should be suppressed (mutual exclusion).
These inhibition links are marked with thin black lines. Each hidden
node is connected by excitation links to all the attribute value nodes that
match the person's properties. These excitation links are marked by
thick green lines.
-
Demonstration
Click on a picture to obtain its full size screen
shot.
|
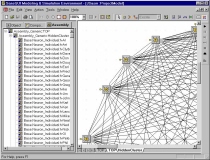
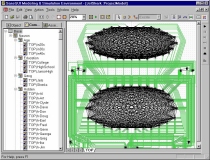 |
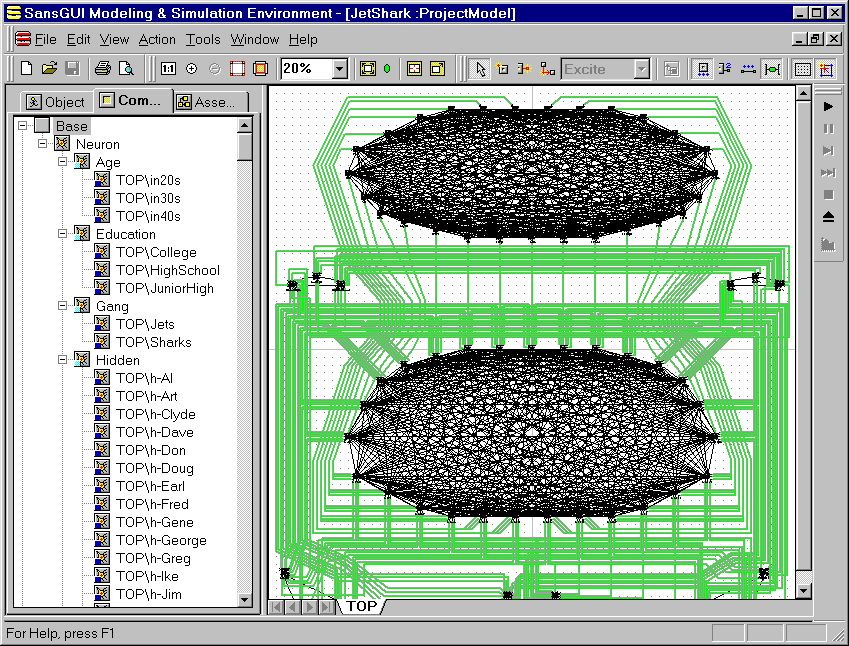
The hidden nodes represent all the
individuals in the center cluster. The top cluster contains the 27
name strings of the persons. The other smaller clusters represent the values
of the rest of the attributes. This model is constructed on a Canvas
View using the modeling facility provided by SansGUI. |
|
 |
The simulation can be
programmatically paused or according to the parameters specified by the user before
a simulation
run. It can also be interactively paused during
the simulation run. The intermediate data can be examined and
plotted. The values can be modified if needed. Data shown in
red are part override values. Data in braces {} are symbolic
parameters. |
|
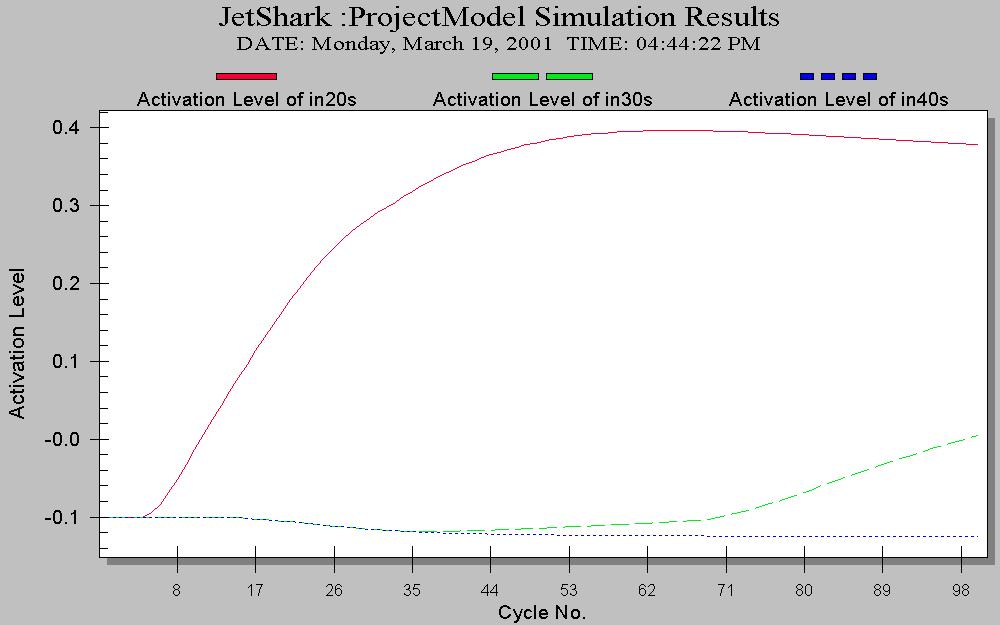
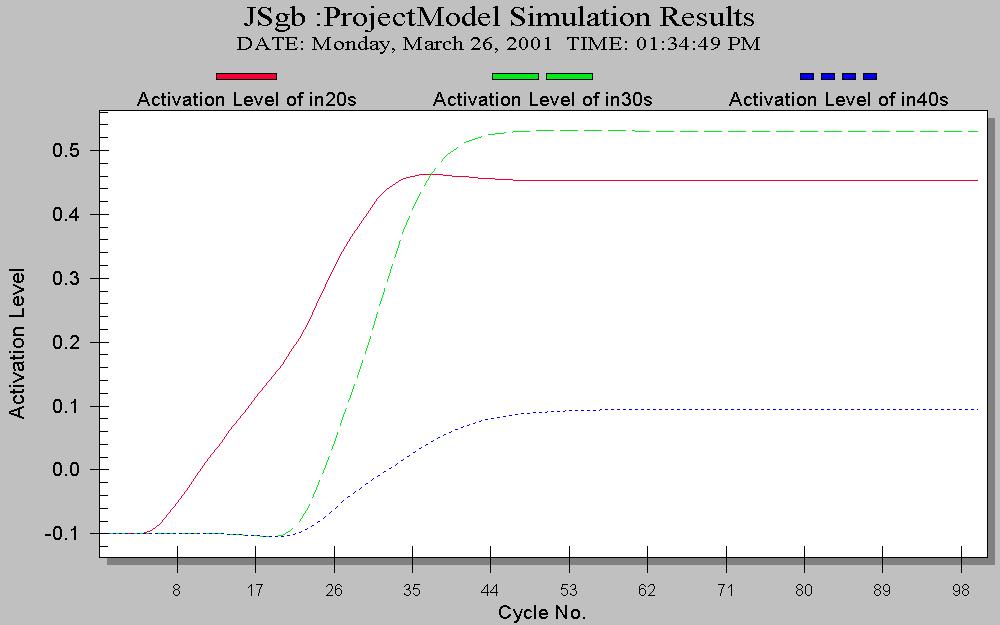
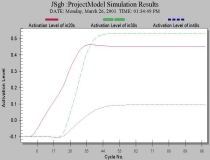
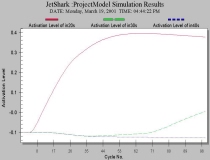 |
The activation levels of the age nodes are
plotted after one of the member's name node has been raised high and 100
cycles have been run. The plot indicates that the member's age is in 20s. |
|
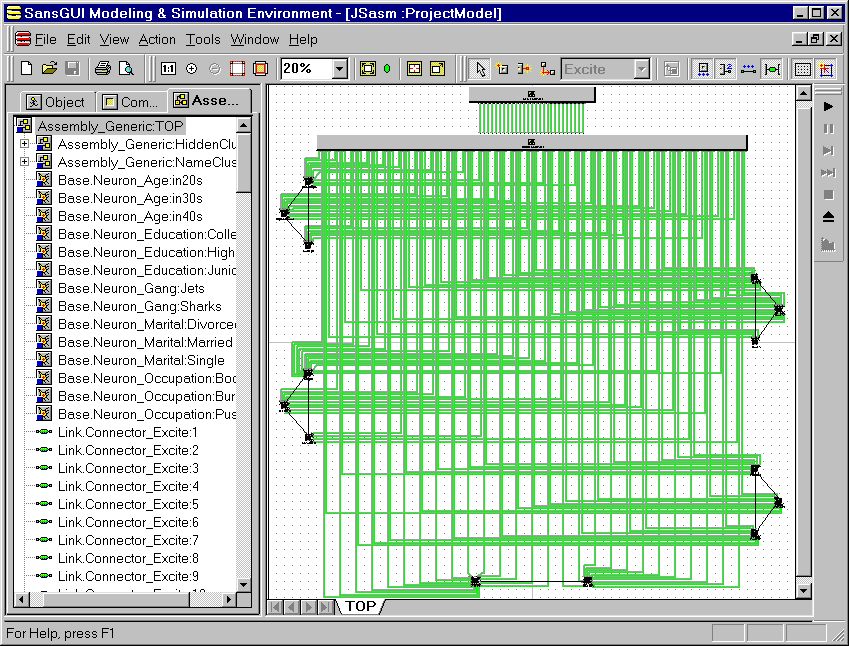
 |
The same model is built with the two 27
node clusters implemented in two subassemblies (on the top of the Canvas
View). |
|
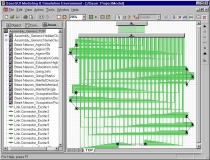
 |
Inside a subassembly, the 27 nodes are
completely connected with inhibitory links. Each node has an
exported port for connections at the parent assembly level. The part
containing the subassembly can be replicated to simplify the model
building process. |
|
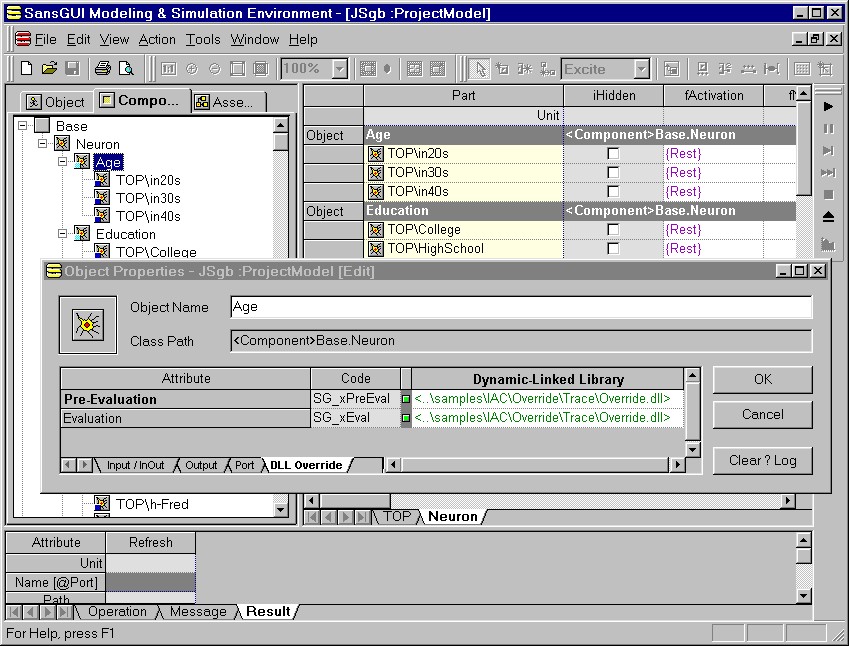
 |
The class functions in the neurons can be
overridden by the user. They can be specified on an object-by-object
basis and overridden at the part level. |
|
 |
The resulting data plotted in this example demonstrate a different
behavior of the neurons, after the user overriding functions are applied. |
-
Details
When any node is stimulated, it generates a "ripple" which will
then propagate through the network
according to these excitation and inhibition links. Once the ripple
settles, the activation level of each node shows the strength of the
relation it has with the ripple originator. A run-time feature in the SansGUI environment
implements the 27 node clusters in a flattened network or in two
subassemblies. The implementation of the functions in the
neurons remains the same. SansGUI handles the interconnectivity among
subassemblies in multiple levels. It is the simulation
developer's decision to open up some of the class functions so that they can be overridden by the
simulation user, as demonstrated in this example. An
article describing this project titled "Creating
Highly Interactive Cycle-Driven Simulators with Minimal Fortran Code"
has been published in Compaq
Visual Fortran Newsletter issue number IX.
-
Code
The implementation of this example can be found in
the functions of the Base.Neuron class.
Click on the following links to see all the necessary code for this
project. The C/C++ and Fortran implementations are independent; only
one of them is required.
-
Download
Please go to the Download
page to obtain an evaluation copy of SansGUI, which includes this example.
-
Credit
This example is extracted from A Tour
of SansGUI Examples in the SansGUI Getting
Started guide. We thank Dr.
James L. McClelland of Carnegie
Mellon University, Pittsburgh, Pennsylvania, for giving the permission
to use his Jets and Sharks model in this example.
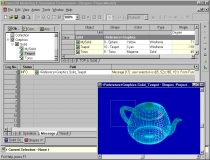
Solid -- Interactive 3D Graphics
in SansGUI
-
Description (New
SansGUI Version 1.2 Feature)
In this example, we explore the new interactive 3D
graphics features in the SansGUI Modeling and Simulation Environment and
demonstrate how SansGUI supports OpenGL graphics programming directly in
Microsoft Visual C++ and Compaq Visual Fortran. As a simulation
developer, you can use the OpenGL API directly in your simulation code; no
additional layers of API are introduced by SansGUI. All the interactive
user interface features, such as 3D object translation, rotation, zooming,
and user selections, are handled by SansGUI, which packs this information
within SansGUI data objects and passes them to your simulation routines.
-
Demonstration
Click on a picture to obtain its full size screen
shot.
|
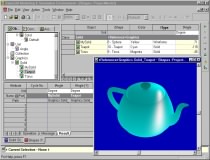 |
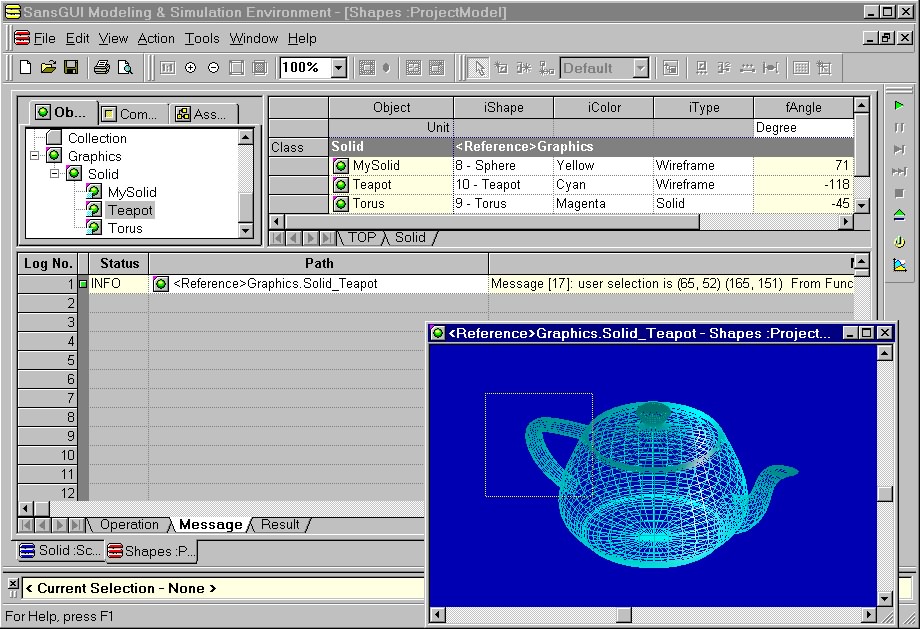
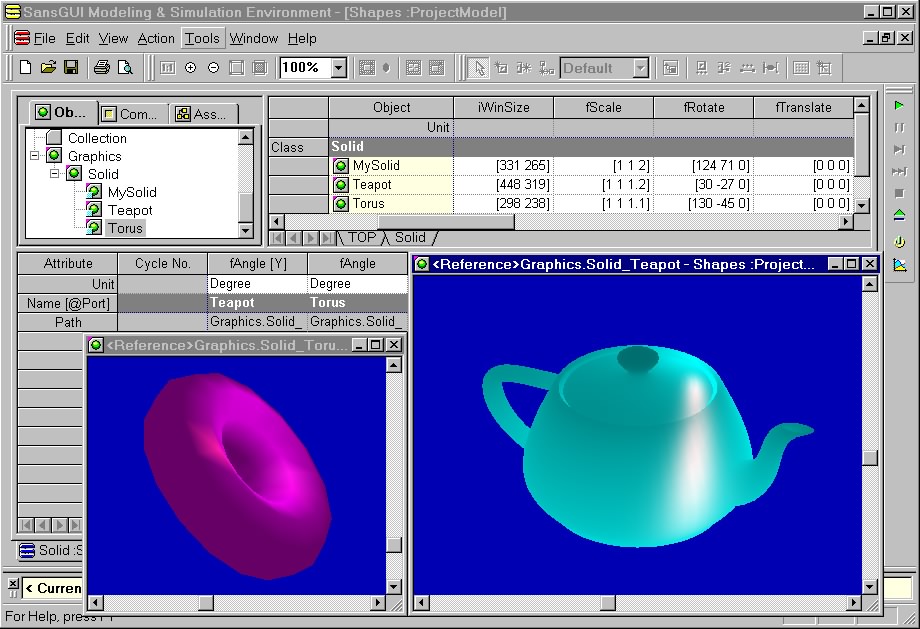
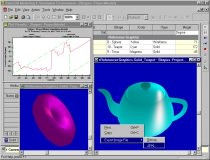
A graphic window is opened to display the
Utah Teapot drawn by the auxSolidTeapot() routine in the OpenGL Auxiliary
Library. The Grid View above the graphic window shows the
properties of the graphic objects. The user can change these
properties directly from the Grid View, or double click on the name of the
object to access its Properties dialog. |
|
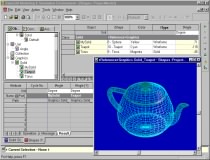 |
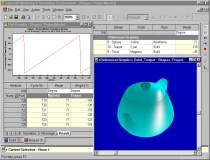
The Display Method (iType) attribute of the
Teapot object has been changed to Wireframe. The graphic display is
updated immediately. A Properties dialog can be used instead to
update the graphic display manually after multiple value changes. |
|
 |
The user can select a point, a line, or a
rectangular area of the graphic window. This example simply echoes the
selection area back to SansGUI by returning a message string containing
the coordinates of the beginning and ending selection points. The
message is shown in the Message View in the Bottom Pane. |
|
 |
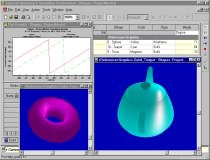
The Solid simulator rotates 3D objects
about the vertical (Y) axis with a fixed increment (5 degrees) per
cycle. When the angle reaches 180 degrees, it is mathematically
converted to -180 degrees and starts over again. The Plot Results
dialog shows a dynamic strip chart of the rotation angle. |
|
 |
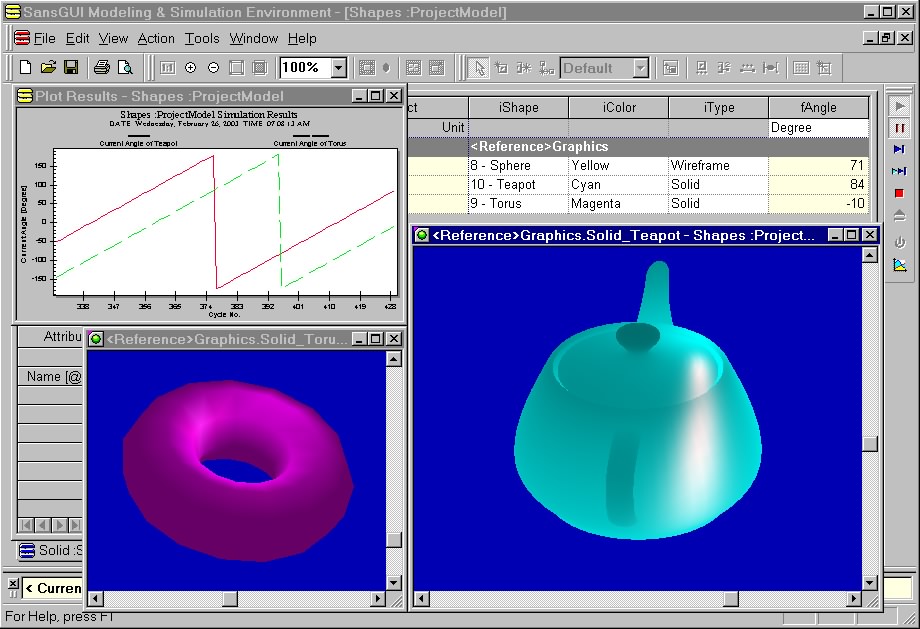
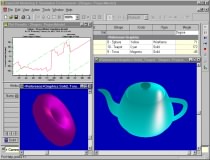
Multiple graphic windows can be opened to
display 3D objects. Simulation can be paused, single stepped, fast
forwarded, or stopped. SansGUI handles all the object instantiation,
multi-threading, and GUI control details so that the simulation developers can
concentrate on the underlying logic and mathematics. |
|
 |
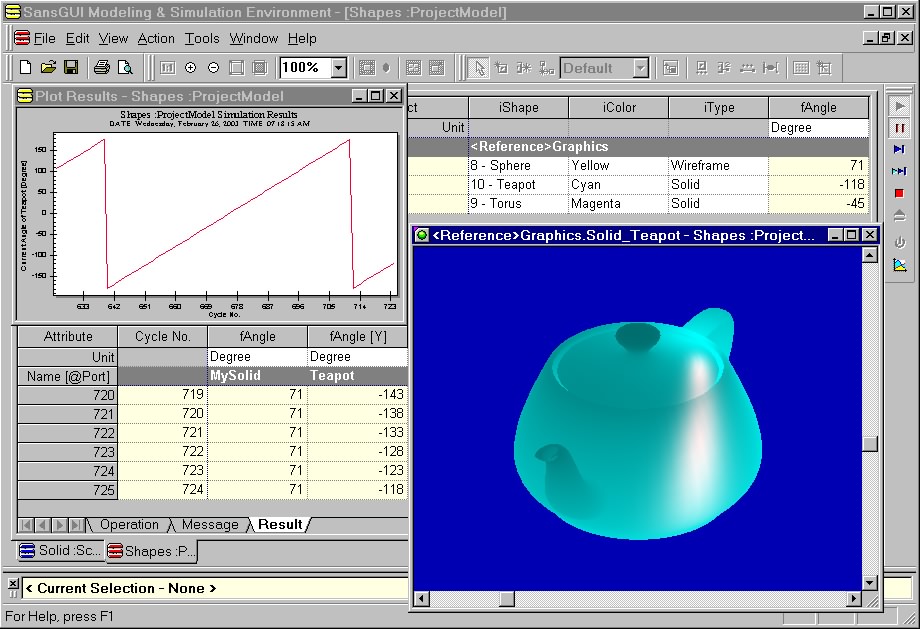
While the simulator is running (rotating
the object about the vertical axis), the user can grab the scroll box to
change the rotation angle, resulting in the irregularly plotted curve in
the strip chart. |
|
 |
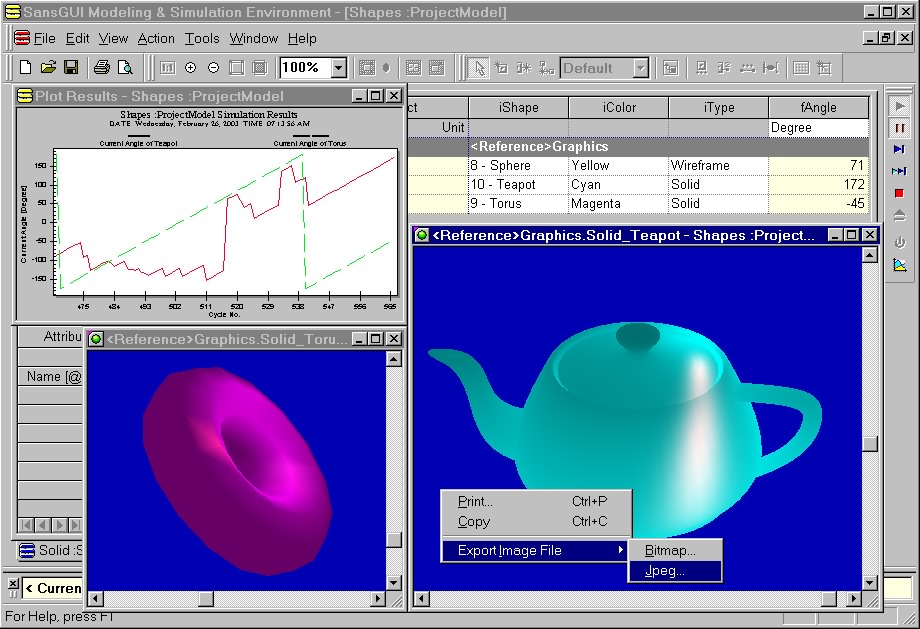
Graphic images can be printed,
copied to Windows clipboard, or exported to an image file using either
Bitmap (.bmp) or JPEG (.jpg) file format. |
|
 |
A Service Session has been entered to
reveal the hidden attributes and their values in the Grid View in the
Right Pane. The service session is protected by a password, which
can be set by the developer. |
|
 |
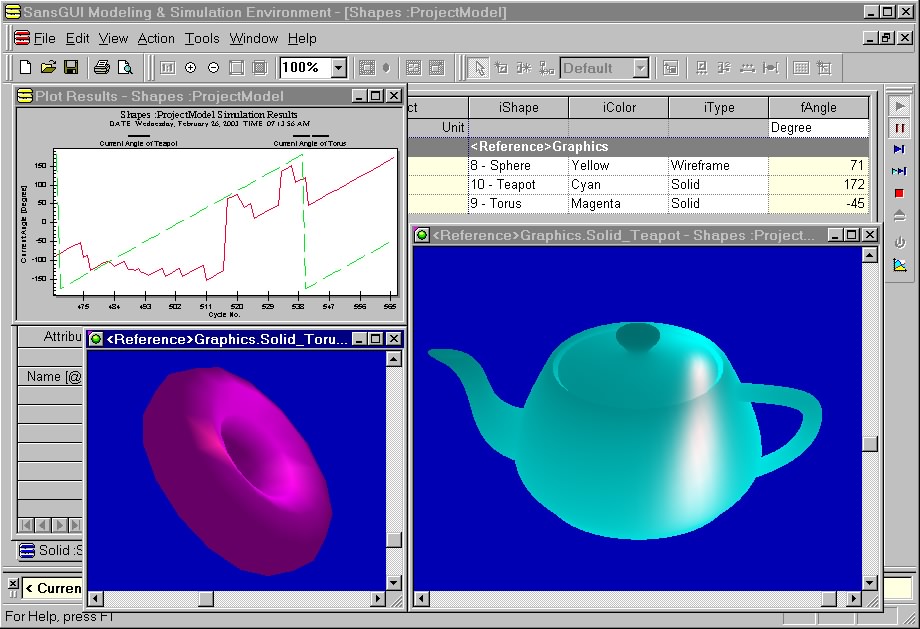
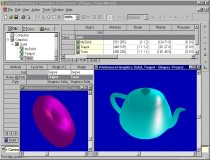
Multiple graphic windows and the SansGUI
dynamic charting facility are working together in a simulation run.
Values in the data grids are updated accordingly. |
|
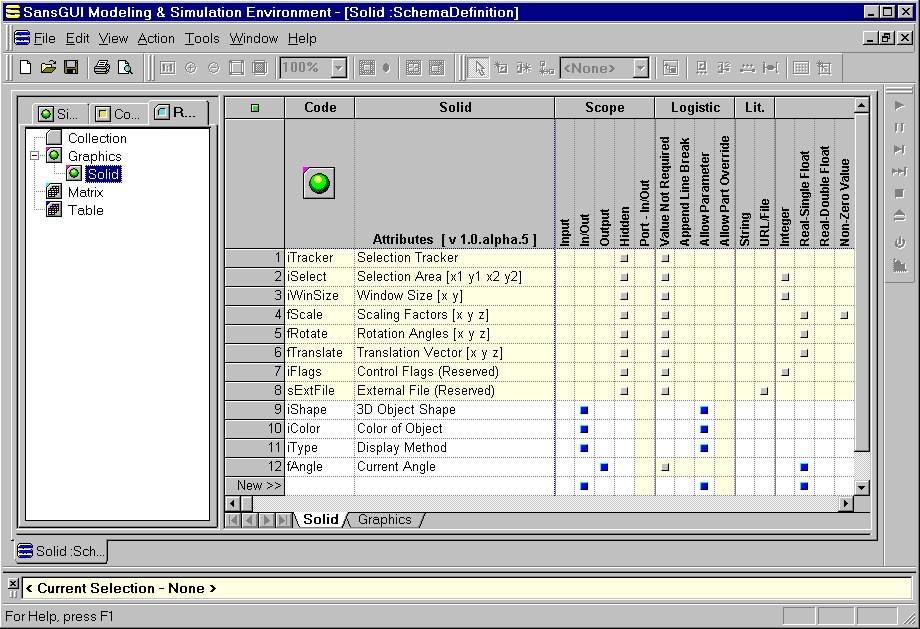
 |
For Developers: Class Solid is a subclass
of the intrinsic Graphics class, which includes a set of hidden attributes
(displayed with a light yellow background). The last four attributes
with white background color are defined for this Solid demonstration
program in the SansGUI Development Environment. |
-
Details
The simulator allows users to
operate on 3D objects displayed by the simulation routines that call the
auxiliary library in OpenGL (GLAUX). The user can rotate the objects,
drag the objects around, zoom into and out of the scene, print the 3D
images, save the images to picture files in Bitmap or JPEG format, and run
the simulation to constantly rotate the objects about the vertical (Y)
axis. It also demonstrates the user interface control facility
provided by the SansGUI Run-Time Environment.
-
Code
The Solid simulator contains a class name Solid,
which is derived from the new Graphics class. The code in Solid simply
calls the OpenGL Auxiliary Library routines aux{Solid|Wire}* to draw
3-dimensional objects. The shapes of the objects can be Tetrahedron, Cube,
Octahedron, Dodecahedron, IcosaHedron, Box, Cylinder, Cone, Sphere,
Torus, and Teapot. They can be displayed in either solid rendering
form or wire frame. Three primitive colors (cyan, magenta,
and yellow) can be applied to the objects by the user.
Click on the following links to see all the necessary code for this
project. The C/C++ and Fortran implementations are independent; only
one of them is required.
-
Download
Please go to the Download
page to obtain an evaluation copy of SansGUI 1.2, which includes this example. It is not included in the version
1.1 distribution.
-
Credit
This example is included in A Tour
of SansGUI Examples in the SansGUI Getting
Started guide. We thank Richard S. Wright, Jr., the author of
OpenGL SuperBible, for sending us the OpenGL Auxiliary Library source code
with his bug fixes.
|
 |
|